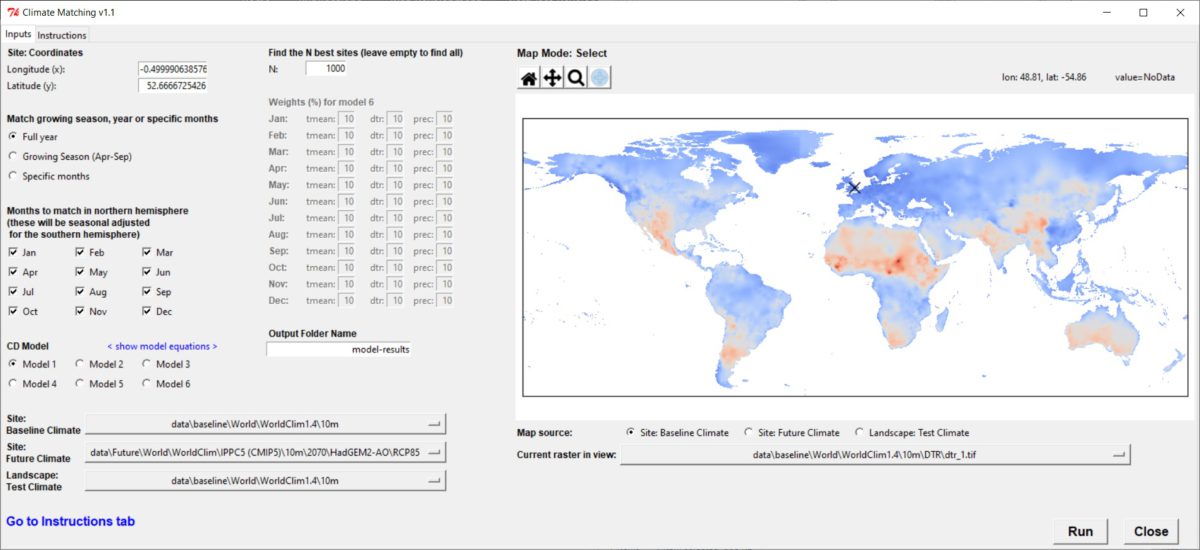
As part of my work for Forest Research I developed a Climate Matching tool to identify regions that are climatically similar to a reference location. This was part of a wider project to identify regions globally where forest reproductive material may be suitable for adapting forestry to reduce the impacts of climate change. The tool is based on the method described in Broadmeadow et al. (2005).
NumPy Vectorisation
Since Python loops are rather slow, it’s a good idea to use NumPy commands wherever possible when performing mathematical operations on large datasets.
For example, in this work we needed to perform a comparison of monthly climate data for a single location against monthly climate data across the globe (using WorldClim data in this instance).
The tool includes a number of different models, but we will focus on one formulation of Climate Difference for this example:
[latex]CD = \sqrt{\left(\sum\limits_{i=1}^{12}\Big\{\left(T_i^o – T_i^f\right)^2\Big\}{}\right)^2+\left(\sum\limits_{i=1}^{12}\Big\{\left({DTR}_i^o – {DTR}_i^f\right)^2\Big\}{}\right)^2+\left(\sum\limits_{i=1}^{12}\Big\{\left(R_i^o – R_i^f\right)^2\Big\}{}\right)^2}[/latex]
[latex]T_i = \text{mean temperature for month } i\\
{DTR}_i = \text{diurnal temperature range for month } i\\
R_i = \text{total precipitation for month } i \\
{}^o = \text{climate value of site to be matched} \\
{}^f = \text{climate value of another location}[/latex]
Our site data is effectively a 1D array (consisting of monthly climate values), but the landscape data is a 3D array (2D landscape x 1D monthly climate values).
This can be broken down into a number of NumPy functions. Firstly, we use np.apply_along_axis, along with a lambda function, to slice the landscape data into 1D arrays of climate for each location and subtract this from the site climate data. We then use np.sum to sum the squared monthly values across the climate axis, reducing it down to a two dimensional landscape array. This is performed for each climate variable (mean temperature, diurnal temperature range and total precipitation), before summing their squares and taking the square root with np.sqrt.
import numpy as np

def calcClimateDif(site, landscape):
    return np.sum(np.apply_along_axis(lambda a: site - a, axis=0, arr=landscape)**2, axis=0)

cdTmean = calcClimateDif(siteClimate.tmean, landscapeClimate.tmean)

cdDtr = calcClimateDif(siteClimate.dtr, landscapeClimate.dtr)

cdPrec = calcClimateDif(siteClimate.prec, landscapeClimate.prec)

cd = np.sqrt(cdTmean**2 + cdDtr**2 + cdPrec**2)
Using NumPy in this way and avoiding Python loops is crucial for performance when processing large datasets: https://towardsdatascience.com/one-simple-trick-for-speeding-up-your-python-code-with-numpy-1afc846db418.